Documentation
How to cite:

Emily Rodriguez & Juan Carlos Villaseñor-Derbez. (2026). RFMO Tuna Catch and Effort Data (Version v0.0.0) [Dataset]. Zenodo. https://doi.org/10.5281/zenodo.21494710
Tuna RFMO Data User Guide
This document provides an overview for users utilizing the harmonized tuna RFMO datasets in this repository. It explains what data are available, how they are structured, and how to load data.
What these data are
This repository harmonizes publicly available catch and effort datasets from three major tuna Regional Fisheries Management Organizations (RFMOs):
- IATTC
- ICCAT
- WCPFC
Each RFMO publishes data in different formats, resolutions, and naming conventions. This repository standardizes them into a unified format so users can work with a single, consistent set of catch and effort datasets.
Available datasets
Files located under data/output/
| Dataset | Gear | Spatial | Temporal | Temporal Coverage | Total Catch (mt) | By Flag | RFMOs Included | Dataset | Formats |
|---|---|---|---|---|---|---|---|---|---|
allrfmo_month_1deg_purseseine.rds |
purse seine | 1°×1° | month | 1958-2024 | 64,848,155 | no | IATTC, ICCAT, WCPFC | allrfmo_month_1deg_purseseine |
.csv, .rds |
allrfmo_year_1deg_purseseine.rds |
purse seine | 1°×1° | year | 1958-2024 | 67,807,604 | no | IATTC, ICCAT, WCPFC | allrfmo_year_1deg_purseseine |
.csv, .rds |
allrfmo_year_1deg_purseseine_flag.rds |
purse seine | 1°×1° | year | 1958-2024 | 54,633,092 | yes | IATTC, ICCAT, WCPFC | allrfmo_year_1deg_purseseine_flag |
.csv, .rds |
allrfmo_month_5deg_longline.rds |
longline | 5°×5° | month | 1950-2024 | 14,527,054 | no | IATTC, ICCAT, WCPFC | allrfmo_month_5deg_longline |
.csv, .rds |
allrfmo_month_5deg_longline_flag.rds |
longline | 5°×5° | month | 1950-2024 | 13,113,173 | yes | IATTC, ICCAT, WCPFC | allrfmo_month_5deg_longline_flag |
.csv, .rds |
allrfmo_year_5deg_longline.rds |
longline | 5°×5° | year | 1951-2024 | 10,944,941 | no | IATTC, ICCAT, WCPFC | allrfmo_year_5deg_longline |
.csv, .rds |
allrfmo_year_5deg_longline_flag.rds |
longline | 5°×5° | year | 1951-2024 | 11,134,893 | yes | IATTC, ICCAT, WCPFC | allrfmo_year_5deg_longline_flag |
.csv, .rds |
Additonal length data
Files located under data/output/
| Dataset | Gear | Spatial | Temporal | Temporal Coverage | By Flag | RMFOs Included | Formats |
|---|---|---|---|---|---|---|---|
wcpfc_length_data |
multi | 5°×5° | multi | 1953-2025 | no | WCPFC | .rds |
Available variables for catch and effort data
| Variables | Description |
|---|---|
rfmo |
Related RFMO |
flag |
Flag code in ISO 3166-1 alpha-3 (excluding SUN) |
lon |
Longitude of fishing activity |
lat |
Latitude of the fishing activity |
year |
Year of record |
month |
Month of record |
effort_set |
Number of fishing sets |
effort_day |
Number of fishing days |
effort_t_hooks |
Thousands of hooks |
catch_tot |
Total catch (mt) |
catch_tot_mt |
Total catch (mt) (for longline datasets) |
catch_tot_num |
Total catch (numbers of tuna caught) (for longline datasets) |
catch_skj |
Catch of skipjack tuna (mt) |
catch_alb |
Catch of albacore tuna (mt) |
catch_bet |
Catch of bigeye tuna (mt) |
catch_yft |
Catch of yellowfin tuna (mt) |
Additional variables specific to length datasets
| Variables | Description |
|---|---|
tstrat |
Temporal stratification |
gear |
Gear type |
species |
Tuna species |
length_cm |
Fish length in centimeters |
length_bin |
Length class/bin in cm based on interval (e.g., 1,2 cm bins) |
Spatial coverage
Downloading .rds data in R
The harmonized tuna RFMO datasets can be loaded directly into R from this GitHub repository without cloning the repository. The datasets for R are stored as .rds files in the data/output/ directory.
To download a dataset:
- Navigate to
data/output/in the GitHub repository. - Select the dataset you want to use.
- Copy the Raw file URL (not the regular GitHub webpage URL).
- Pass the URL to
readRDS()as shown below.
For example:
raw_url <- "https://raw.githubusercontent.com/jcvdav/tuna_data/main/data/output/allrfmo_month_1deg_purseseine.rds"

tuna_data <- readRDS(url(raw_url))

head(tuna_data)
# A tibble: 6 × 12
rfmo lon lat year month effort_set effort_day catch_tot catch_skj
<chr> <dbl> <dbl> <dbl> <dbl> <dbl> <dbl> <dbl> <dbl>
1 wcpfc 148. -42.5 1999 3 17 13.4 64 64
2 wcpfc 172. -41.5 2012 3 20 20 804. 804.
3 wcpfc 172. -41.5 2012 4 7 7 346. 346.
4 wcpfc 172. -41.5 2014 4 21 21 1376. 1376.
5 wcpfc 148. -40.5 2000 3 13 10.2 122 122
6 wcpfc 172. -40.5 2014 3 12 12 836 836
# ℹ 3 more variables: catch_alb <dbl>, catch_bet <dbl>, catch_yft <dbl>Downloading .csv Data
.rds files are recommended for R users, but .csv files are also available for Excel users.
To download a .csv dataset to your computer:
- Navigate to the
data/output/directory in the GitHub repository. - Select the
.csvfile you would like to download. - Click the Download raw file button.
- Save the file to your desired location on your computer.
Dataset overviews
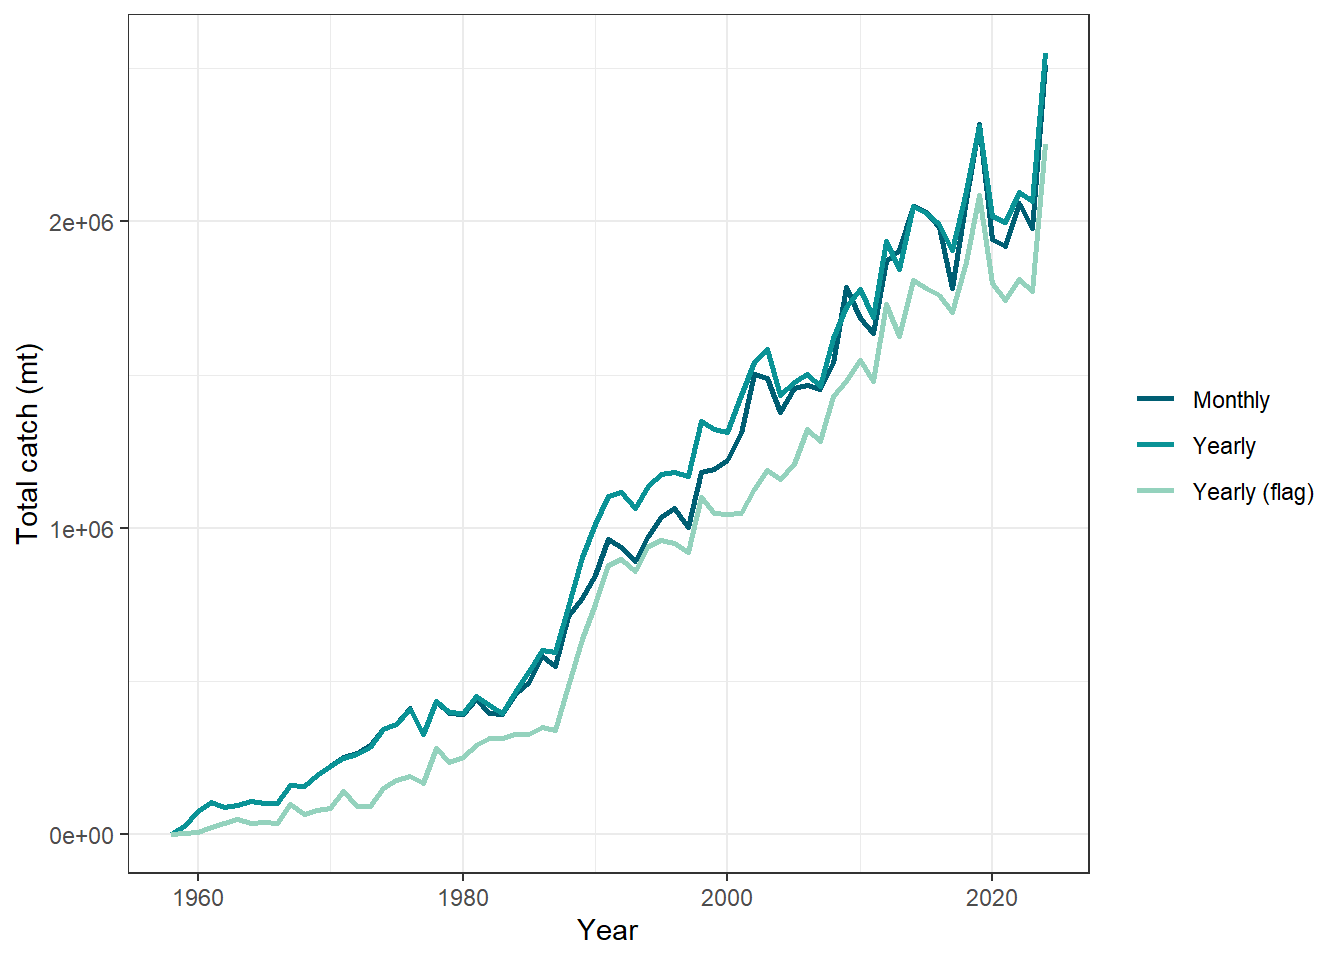
Purse seine catch time series
Show code for creating catch time series
### Creating a purse seine catch time series ###################################

# Combine purse seine datasets into a single table
ps_ts <- bind_rows(

  # Aggregate each dataset's catch into annual catch totals

  # Monthly purse seine data
  month_1deg_ps |>

    # Organize observations into groups by year
    group_by(year) |>

    # Calculate the total catch each year
    summarise(catch = sum(catch_tot, na.rm = TRUE)) |>

    # Create a new column called "dataset" that identifies which source dataset produced each time series
    mutate(dataset = "Monthly"),

  # Yearly purse seine data
  year_1deg_ps |>
    group_by(year) |>
    summarise(catch = sum(catch_tot, na.rm = TRUE)) |>
    mutate(dataset = "Yearly"),

  # Yearly purse seine data, by flag
  year_1deg_ps_flag |>
    group_by(year) |>
    summarise(catch = sum(catch_tot, na.rm = TRUE)) |>
    mutate(dataset = "Yearly (flag)")
)

#### Plot the summarized data ##################################################

ggplot(ps_ts,
       aes(x = year,
           y = catch,
           color = dataset)) +

  # geom_line() adds a line connecting observations through time
  geom_line(linewidth = 1) +
  scale_color_manual(
    values = c(
      "Monthly" = "#005F73",
      "Yearly" = "#0A9396",
      "Yearly (flag)" = "#94D2BD"
    )) +
  theme_bw() +
  labs(
    x = "Year",
    y = "Total catch (mt)",
    color = NULL
  )
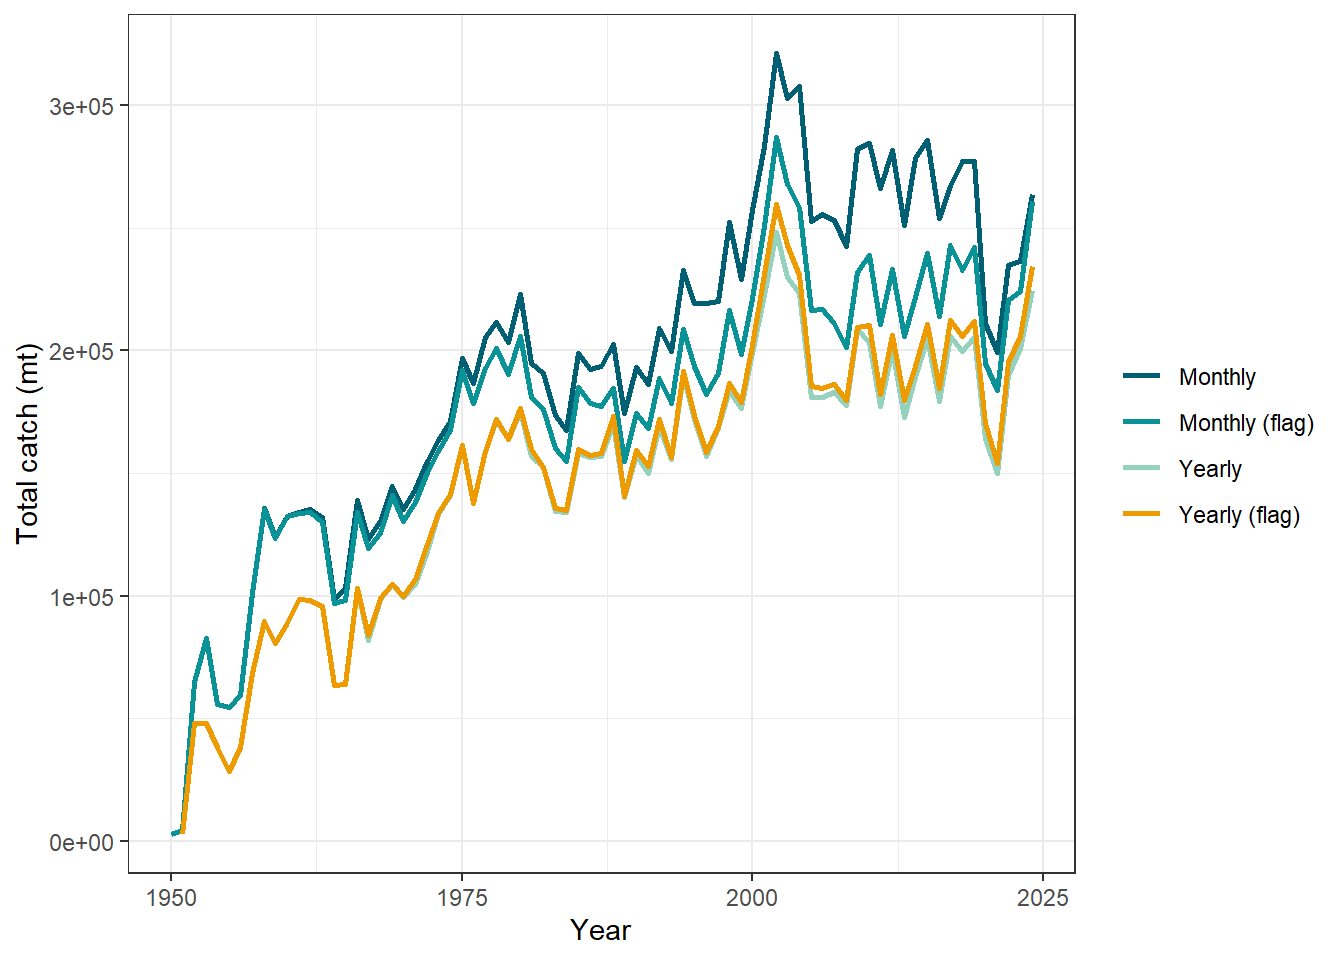
Longline catch time series
Show code for creating catch time series
### Creating a longline catch time series ######################################

# Combine longline datasets into a single table
ll_ts <- bind_rows(

  # Aggregate each dataset's catch into annual catch totals

  # Monthly longline data
  month_5deg_ll |>

    # Organize observations into groups by year
    group_by(year) |>

    # Calculate the total catch each year
    summarise(catch = sum(catch_tot_mt, na.rm = TRUE)) |>

    # Create a new column called "dataset" that identifies which source dataset produced each time series
    mutate(dataset = "Monthly"),

  # Montly longline data where catch with flag data
  month_5deg_ll_flag |>
    group_by(year) |>
    summarise(catch = sum(catch_tot_mt, na.rm = TRUE)) |>
    mutate(dataset = "Monthly (flag)"),

  # Annual longline dataset
  year_5deg_ll |>
    group_by(year) |>
    summarise(catch = sum(catch_tot_mt, na.rm = TRUE)) |>
    mutate(dataset = "Yearly"),

  # Annual longline dataset with flag data
  year_5deg_ll_flag |>
    group_by(year) |>
    summarise(catch = sum(catch_tot_mt, na.rm = TRUE)) |>
    mutate(dataset = "Yearly (flag)")
)

#### Plot the summarized data ##################################################

ggplot(ll_ts,
       aes(x = year,
           y = catch,
           color = dataset)) +

  # geom_line() adds a line connecting observations through time
  geom_line(linewidth = 1) +
  scale_color_manual(
    values = c(
      "Monthly" = "#005F73",
      "Monthly (flag)" = "#0A9396",
      "Yearly" = "#94D2BD",
      "Yearly (flag)" = "#EE9B00"
    )
  ) +

  theme_bw() +
  labs(
    x = "Year",
    y = "Total catch (mt)",
    color = NULL
  )
User feedback
If you identify a bug, data issue, inconsistency, typo, or other problem, please open a GitHub issue and include as much detail as possible:
- Location of the issue: Specify the relevant file, dataset, or script.
- Description of the problem: Explain what problem you observed.
- Reason for concern: Describe why you believe this may be an issue (e.g., incorrect values, missing information, unclear documentation, incorrect filtering).